Monitoring dashboard
The Monitoring dashboard in the Neon console provides several graphs for monitoring system and database metrics. You can access the Monitoring dashboard from the sidebar in the Neon Console. Observable metrics include:
Your Neon plan defines the range of data you can view.
| Neon Plan | Data Access |
|---|---|
| Free Tier | Last day (24 hours) |
| Launch | Last 7 days (168 hours) |
| Scale | Last 14 days (336 hours) |
A shorter or custom period can be selected within the permitted range by selecting the desired option from the Other menu on the dashboard.
The dashboard displays metrics for the selected Branch and Compute endpoint. Use the drop-down menus to view metrics for a different branch or compute. Use the Refresh button to update the displayed metrics.
If your compute was idle or there has not been much activity, charts may display this message: There is not enough metrics data for this compute. In this case, try again later after more usage data has been collected.
note
The values and plotted lines in your graphs may go to 0 during periods when your compute is not active. For example, RAM, CPU, and Database size values lines go to 0 when a compute transitions to an idle state due to being suspended after a period of inactivity.
RAM
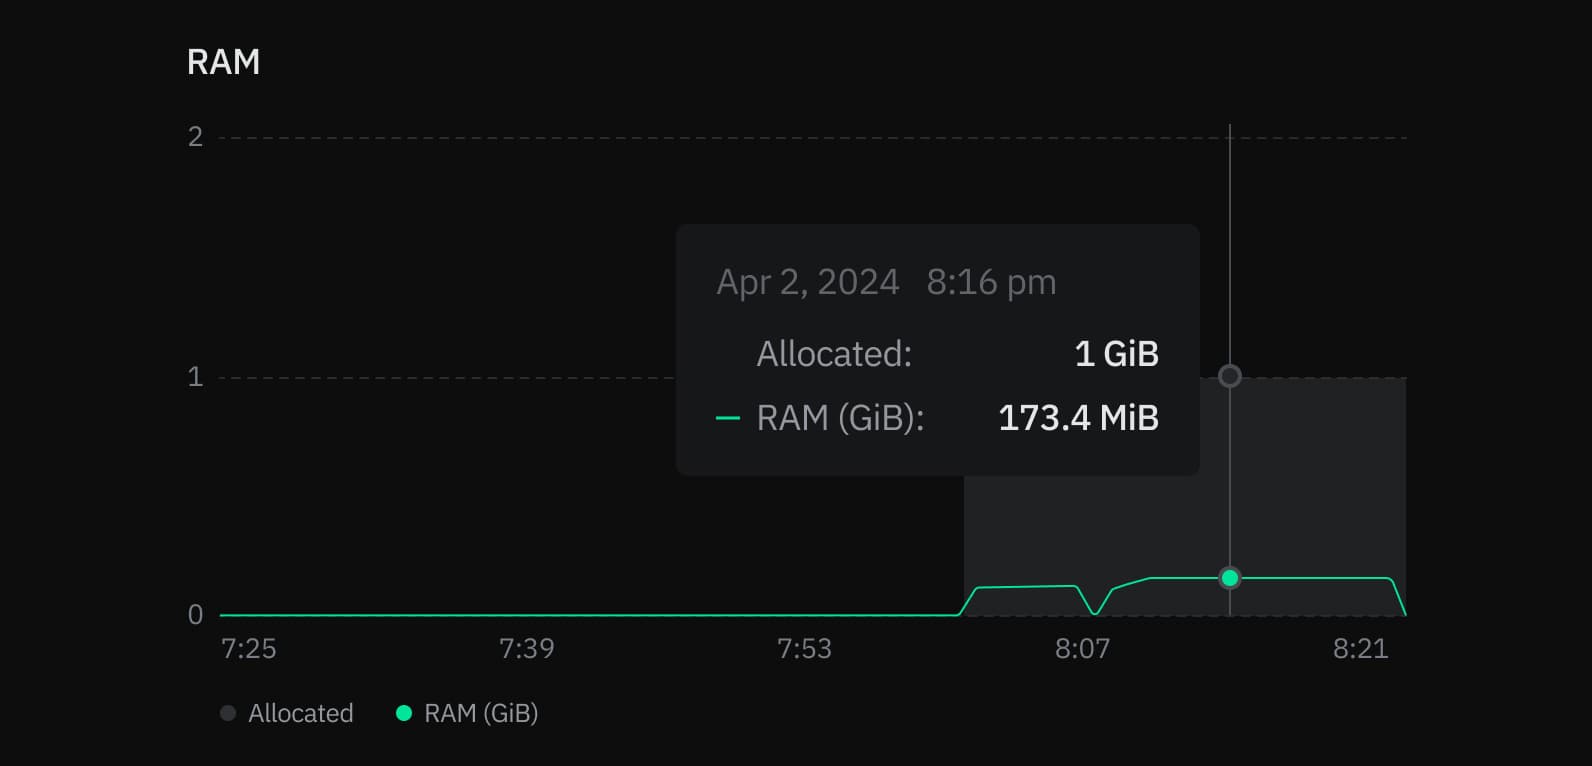
This graph shows allocated RAM and usage over time for the selected compute.
ALLOCATED: The amount of allocated RAM.
RAM is allocated according to the size of your compute or your autoscaling configuration, if applicable. For example, if your compute size is .25 CU (.25 vCPU with 1 GB RAM), your allocated RAM is always 1 (GiB). With autoscaling, allocated RAM increases and decreases as your compute size scales up and down in response to load. If autosuspend is enabled and your compute transitions to an idle state after a period of inactivity, allocated RAM drops to 0.
Used: The amount of RAM used.
The chart plots a line showing the amount of RAM used. If the line regularly reaches the maximum amount of allocated RAM, consider increasing your compute size to increase the amount of allocated RAM. To see the amount of RAM allocated for each Neon compute size, see Compute size and autoscaling configuration.
CPU
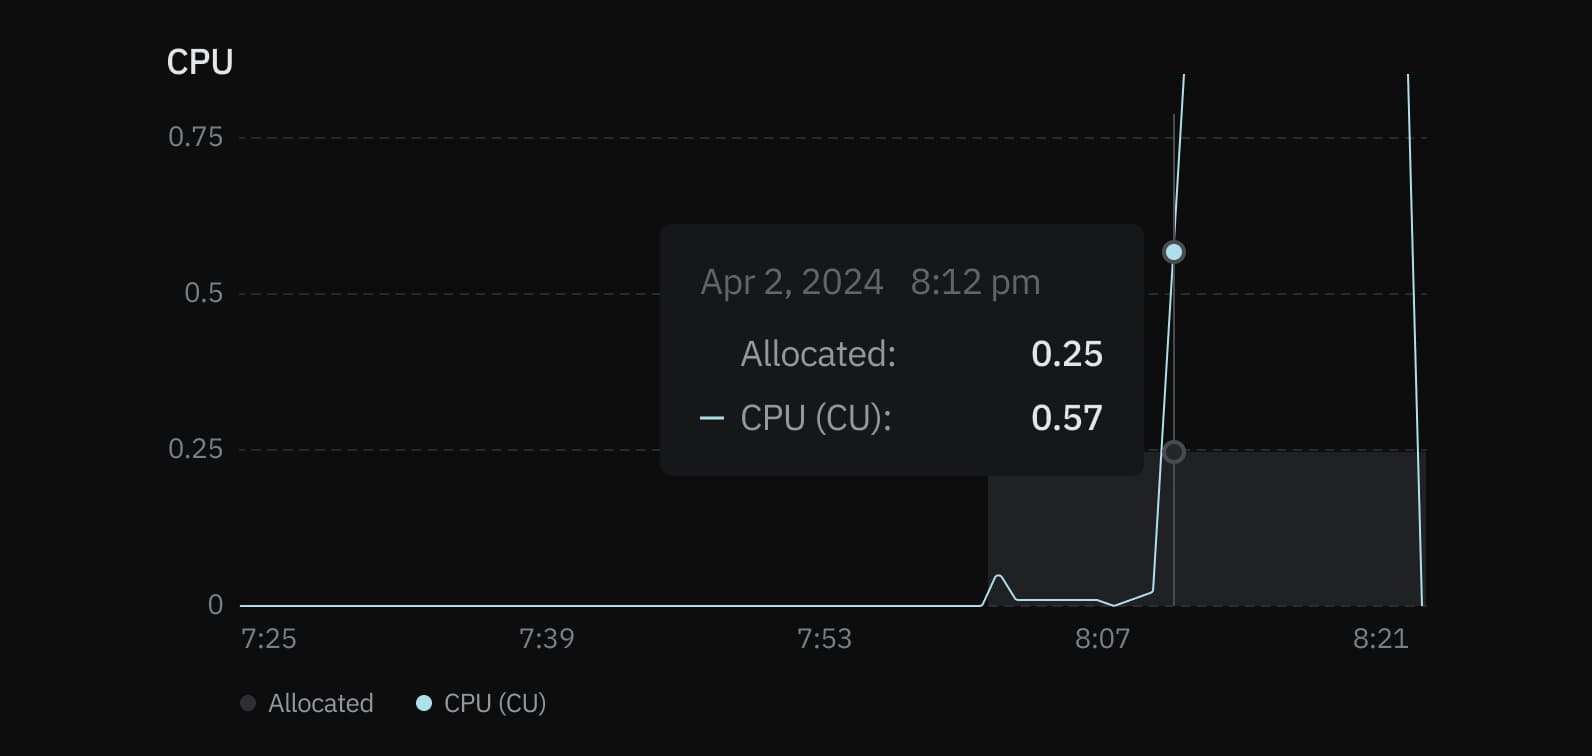
This graph shows the amount of allocated CPU and usage over time for the selected compute.
ALLOCATED: The amount of allocated CPU.
CPU is allocated according to the size of your compute or your autoscaling configuration, if applicable. For example, if your compute size is .25 CU (.25 vCPU with 1 GB RAM), your allocated CPU is always 0.25. With autoscaling, allocated CPU increases and decreases as your compute size scales up and down in response to load. If autosuspend is enabled and your compute transitions to an idle state after a period of inactivity, allocated CPU drops to 0.
Used: The amount of CPU used, in Compute Units (CU).
If the plotted line regularly reaches the maximum amount of allocated CPU, consider increasing your compute size. To see the compute sizes available with Neon, see Compute size and autoscaling configuration.
Connections count
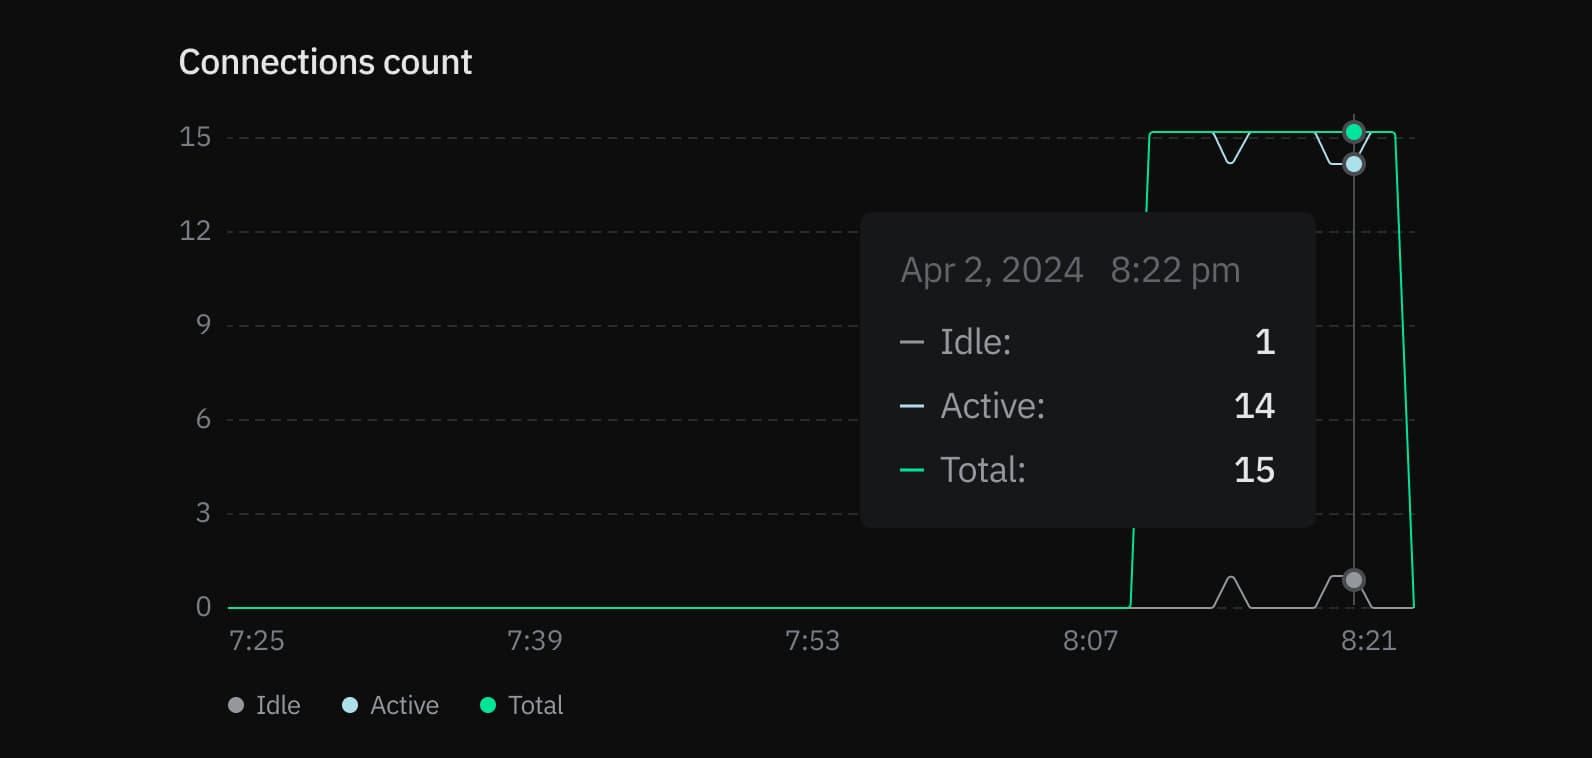
The Connections count graph shows the number of idle connections, active connections, and the total number of connections over time for the selected compute.
ACTIVE: The number of active connections for the selected compute.
Monitoring active connections can help you understand your database workload at any given time. If the number of active connections is consistently high, it might indicate that your database is under heavy load, which could lead to performance issues such as slow query response times. See Connections for related SQL queries.
IDLE: The number of idle connections for the selected compute.
Idle connections are those that are open but not currently being used. While a few idle connections are generally harmless, a large number of idle connections can consume unnecessary resources, leaving less room for active connections and potentially affecting performance. Identifying and closing unnecessary idle connections can help free up resources. See Find long-running or idle connections.
TOTAL: The sum of active and idle connections for the selected compute.
The limit on the maximum number of simultaneous connections (defined by the Postgres max_connections setting) is set according to your Neon compute size. Monitoring the total number of connections helps ensure you don't hit your connection limit, as reaching it can prevent new connections from being established, leading to connection errors. For the connection limit for each Neon compute size, see How to size your compute. Increasing your compute size is one way to increase your connection limit. Another option is to use connection pooling, which supports up to 10,000 simultaneous connections. To learn more, see Connection pooling.
Database size
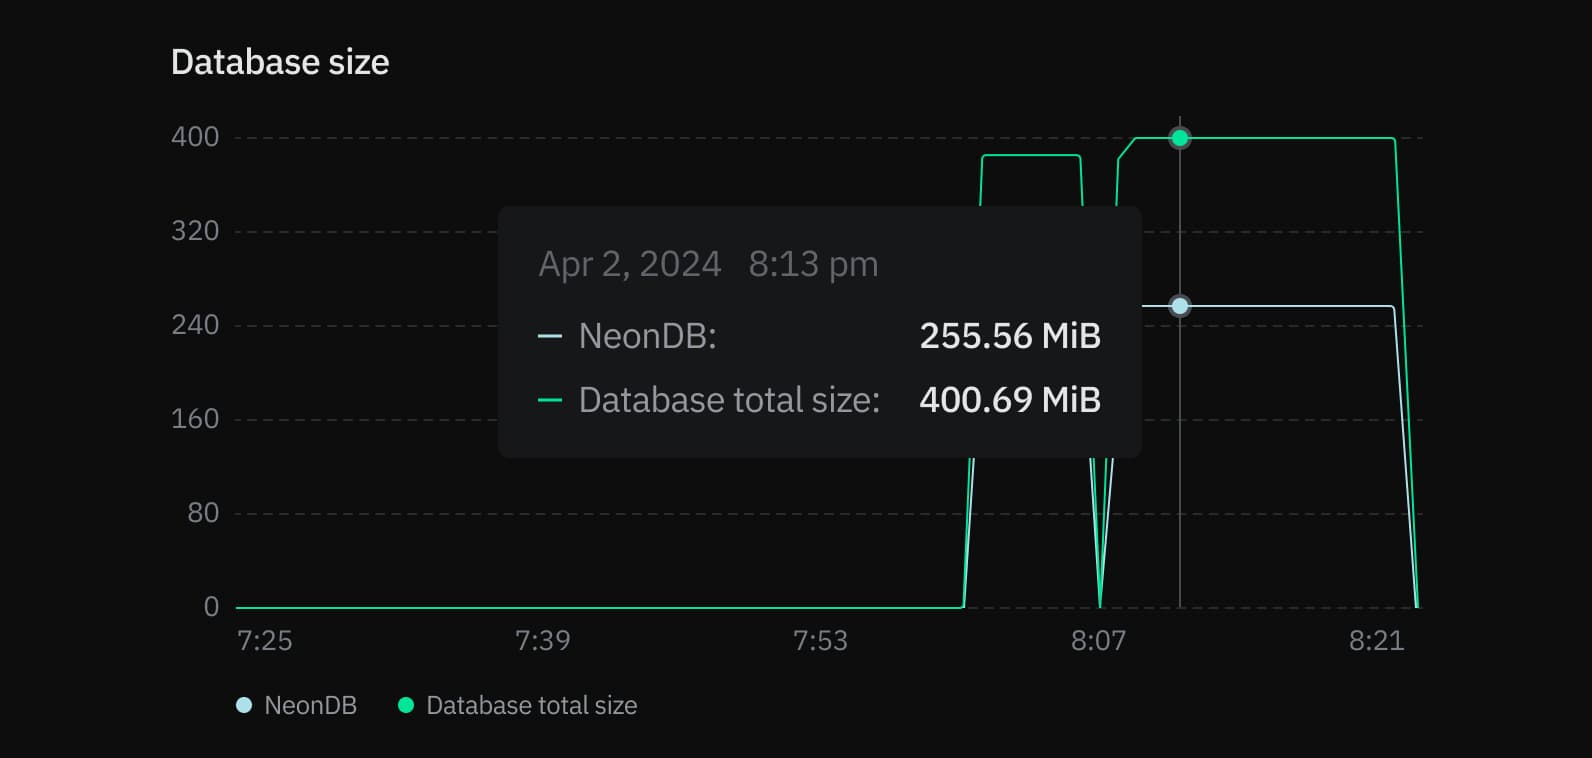
The Database size graph shows the logical data size (the size of your actual data) for the named database and the total size for all user-created databases (Database total size) on the selected branch. The named database is always the oldest database on the selected branch. Database size differs from the storage size of your Neon project, which includes the logical data size plus history. The Database total size metric is only shown when there is more than one database on the selected branch.
important
Database size metrics are only displayed while your compute is active. When your compute is idle, database size values are not reported, and the Database size graph shows zero even though data may be present.
Deadlocks
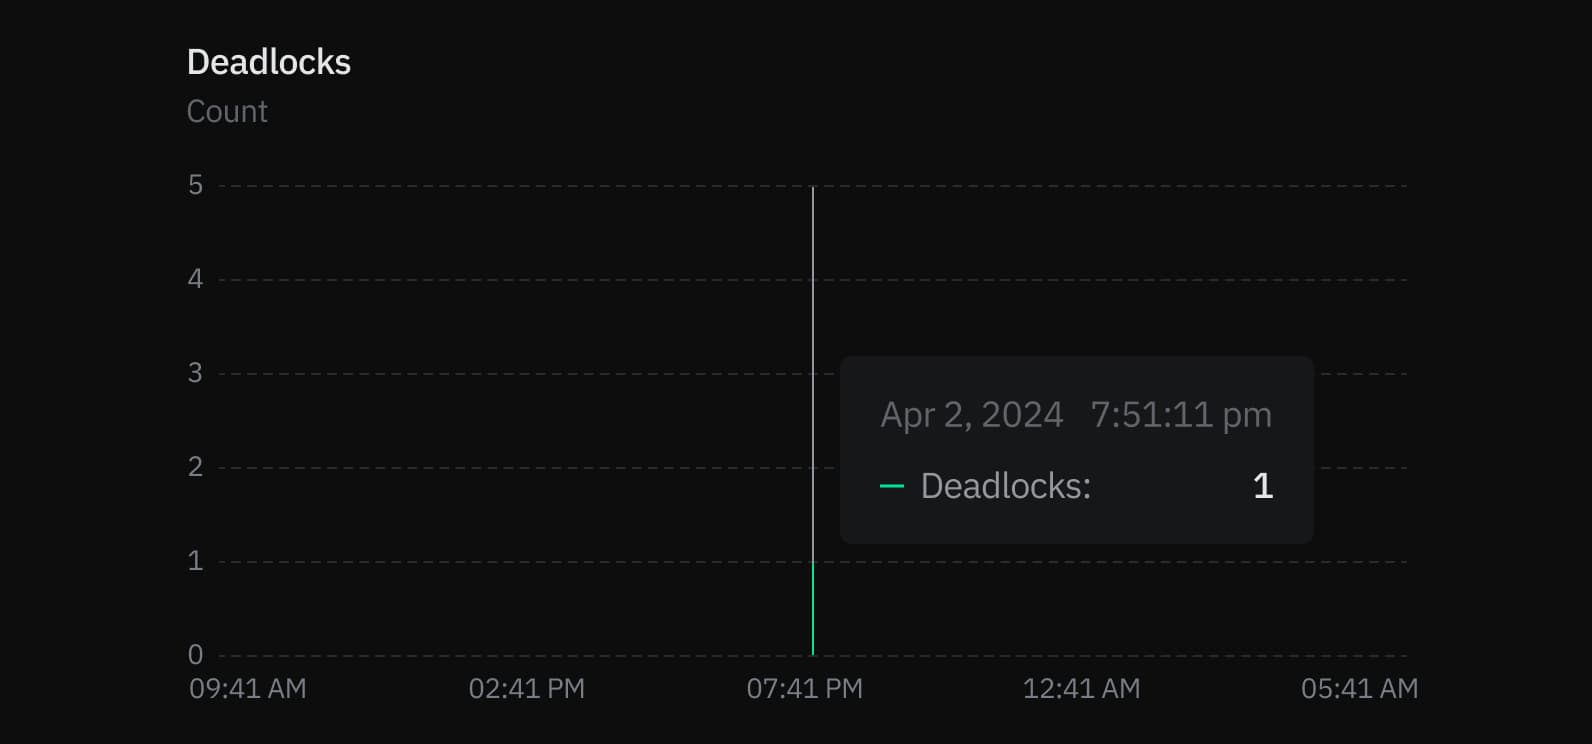
The Deadlocks graph shows a count of deadlocks over time for the named database on the selected branch. The named database is always the oldest database on the selected branch.
Deadlocks occur in a database when two or more transactions simultaneously block each other by holding onto resources the other transactions need, creating a cycle of dependencies that prevent any of the transactions from proceeding, potentially leading to performance issues or application errors. For lock-related queries you can use to investigate deadlocks, see Performance tuning. To learn more about deadlocks in Postgres, see Deadlocks.
Rows
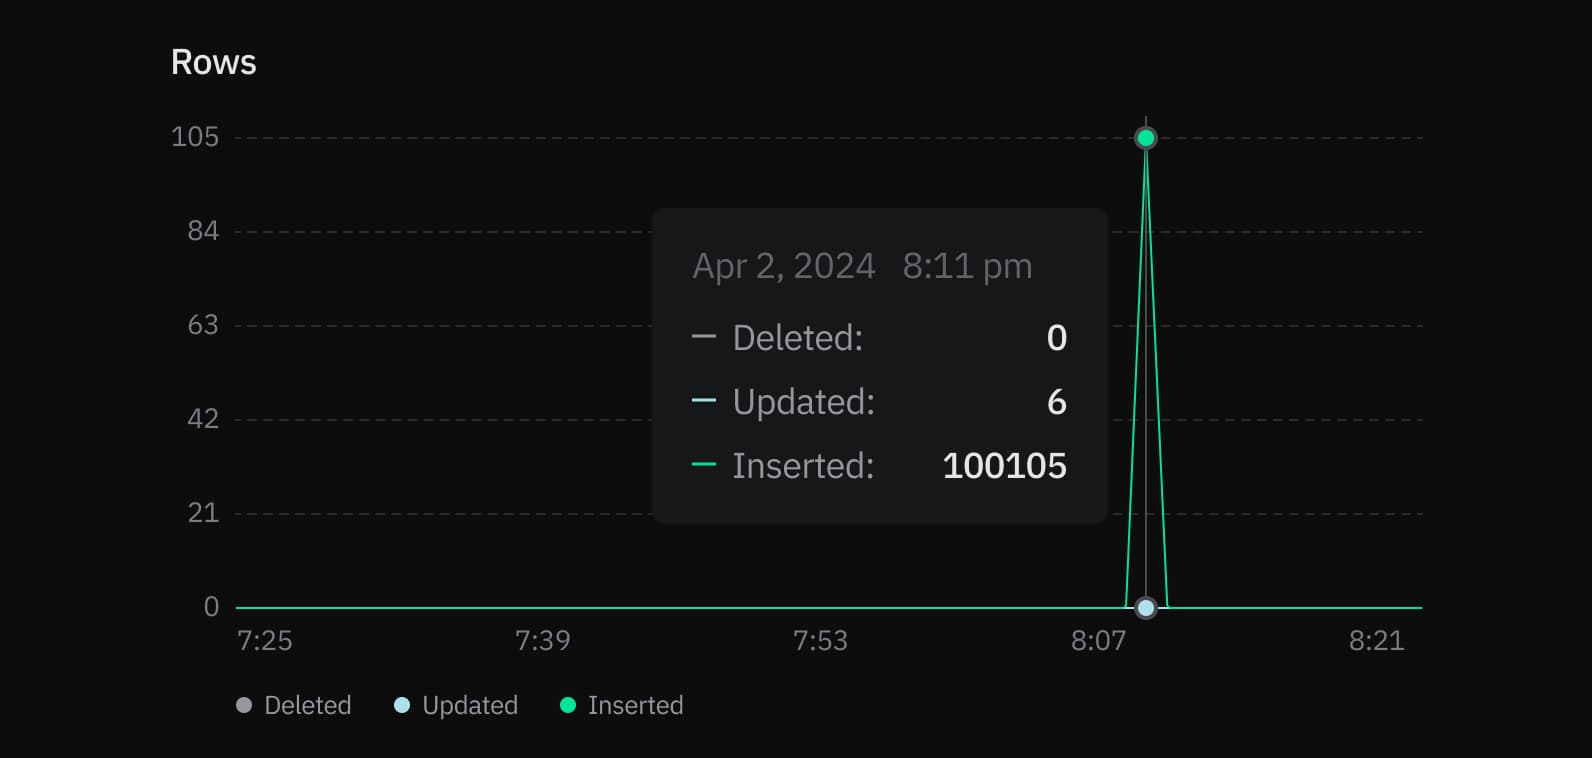
The Rows graph shows the number of rows deleted, updated, and inserted over time for the named database on the selected branch. The named database is always the oldest database on the selected branch. Row metrics are reset to zero whenever your compute restarts.
Tracking rows inserted, updated, and deleted over time provides insights into your database's activity patterns. You can use this data to identify trends or irregularities, such as insert spikes or an unusual number of deletions.
Last updated on